3. Probability Distribution functions-PDF,PMF,CDF
Random Variables vs Algebraic Variables
In Algebraic variables the unknown values can be 'x'
the x can be any values for example x+5=10
here the x=5
Random Variables
It is a set of possible values from a random experiment
example
x={1,2,3,4,5,6,7} here the random variable 'i' can be 1 or 2 or 3 and so on..
which are randomly selected from the list
For the differentiating between random and algebraic values in written format the Random variables are written in capital letters 'X' 'Y' 'Z'
Types of Random Variables
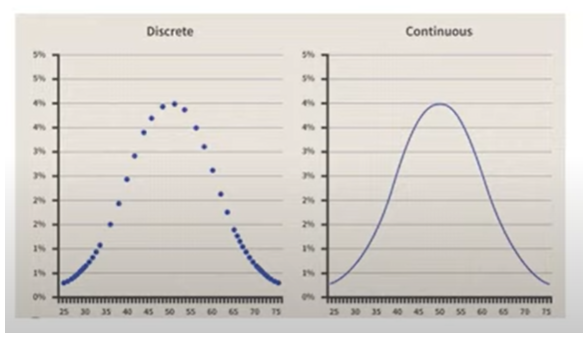
- Discrete
- Continous
Discrete
Heads or tails where the values of outcome is fixed where it is either head or tail
also for dice ,outcome can be from [1,2,3,4,5,6] and not 1.3, 4.5 its fixed
Continous
Here the values can vary
like cgpa in a class from 1 to 10
it can be either 8.2 or .8.3 or 9.2 and so on
Probability distributions
What is probability Distributions
List of all possible outcomes of a random variable along with their coresoponding probability values
lets consider a example
where we are tossing a coin where the outcomes can be either heads or tails
| Cointoss | Heads | Tails |
|---|---|---|
| Prob. of | 1/2 | 1/2 |
| Also for dice the probabililty would be |
| 1 | 2 | 3 | 4 | 5 | 6 |
|---|---|---|---|---|---|
| 1/6 | 1/6 | 1/6 | 1/6 | 1/6 | 1/6 |
Now consider there are 2 dice so each would have 6 different possible outcomes and the sum for both would be 12
| dice | 1 | 2 | 3 | 4 | 5 | 6 |
|---|---|---|---|---|---|---|
| 1 | 2 | 3 | 4 | 5 | 6 | 7 |
| 2 | 3 | 4 | 5 | 6 | 7 | 8 |
| 3 | 4 | 5 | 6 | 7 | 8 | 9 |
| 4 | 5 | 6 | 7 | 8 | 9 | 10 |
| 5 | 6 | 7 | 8 | 9 | 10 | 11 |
| 6 | 7 | 8 | 9 | 10 | 11 | 12 |
| so from the above table we can conclude that there are 36 possible outcomes for 2 dice roll | ||||||
| now probability for each outcome can be calculated as |
2 -> 1/36
3 -> 2/36
4 -> 3/36
5 -> 4/36
6 -> 5/36
7 -> 6/36
8 -> 5/36
9 -> 4/36
10 -> 3/36
11 -> 2/36
12 -> 1/36
Now problem with this distribution is no of outcome can be much larger with more values and hence the tabe would be more tedious to write down example rolling 10 dice can get the sum as 60 so it would be very hard to make
Solution
what if we use a mathematical function to model the relationship between outcome and probability
function like y=f(X)=...
| X(outcome) | 1 | 2 | 3 | 4 | 5 | 6 |
|---|---|---|---|---|---|---|
| Y(Probability) | 1/6 | 1/6 | 1/6 | 1/6 | 1/6 | 1/6 |
| (Note: the term probability distribution and probability distributin functions are used interchangebly where both are the same) |
Why are probability distributions important?
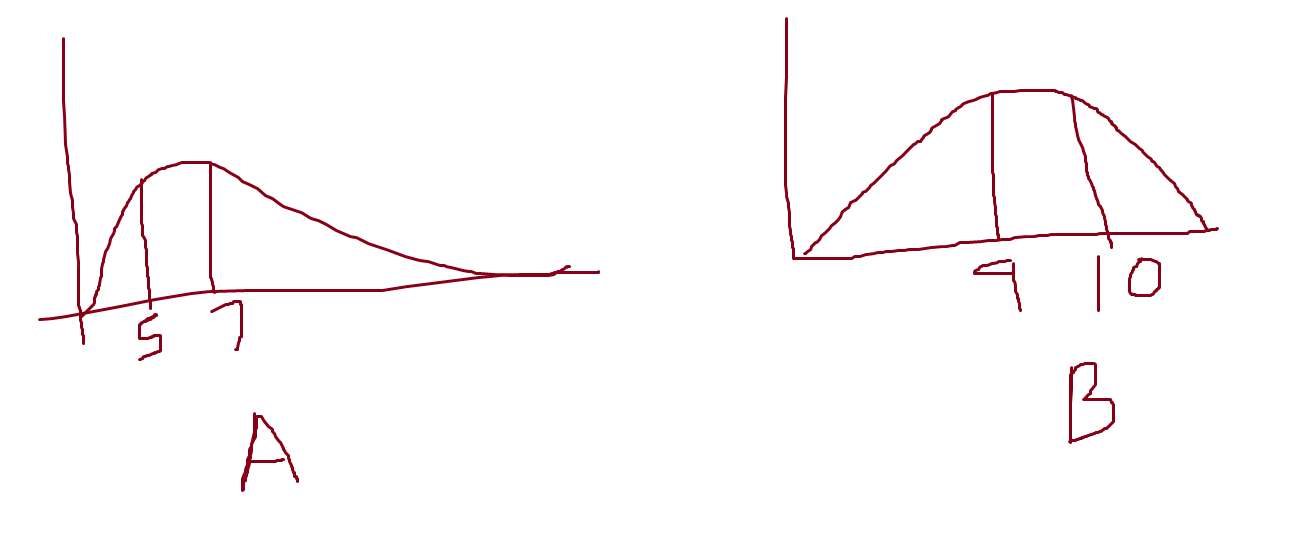
now consider the above 2 graphs of distributions where there are 2 class of students a and b and the distribution is their marks
so from the graph we can conclude that there are weak students in class a where the most students marks are from 5 7 cgpa and in the graph of class B the curve is on higher side form 9 to 10 cgpa
Gives an idea about the shape/distribution of the data